The visual representation of complexity: Sixteen key characteristics of complex systems
 Lists
Lists Lists
Lists


Boehnert, Joanna (2018) The visual representation of complexity: Sixteen key characteristics of complex systems. In: Proceedings of RSD7, Relating Systems Thinking and Design 7, 23-26 Oct 2018, Turin, Italy.
Preview |
Text
Boehnert_Visual_2018.pdf Download (2MB) | Preview |
Preview |
Text
Boehnert_Slides_2018.pdf Download (5MB) | Preview |
![[thumbnail of Boehnert_MM_2018.jpg]](https://openresearch.ocadu.ca/id/eprint/2737/3/Boehnert_MM_2018.jpg "Boehnert_MM_2018.jpg")  Preview |
Image
Boehnert_MM_2018.jpg Download (243kB) | Preview |
Abstract
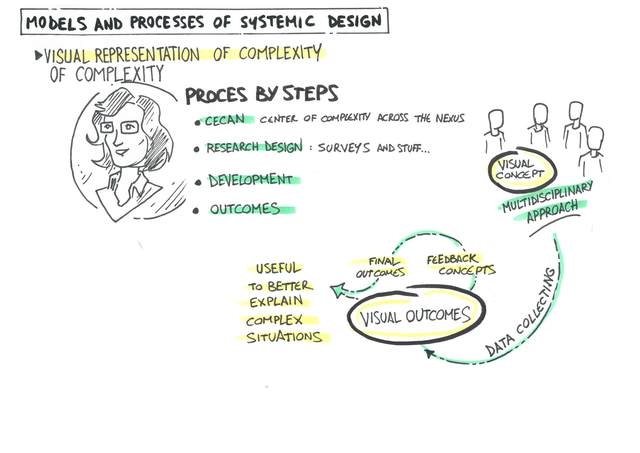
Sustainability practitioners have long relied on images to communicate complexity. Visual communication plays an important role in facilitating learning and collaboration on social, environmental and economic issues that are characterised as complex systems. The Visual Representation of Complexity was a short research project conducted for CECAN (Centre for the Evaluation of Complexity Across the Nexus) at the University of Surrey (UK) and completed at the Loughborough University. The research addresses the need for imagery capturing key characteristics of complex systems that will be widely understood across different fields and sectors. The work facilitates learning by helping researchers, policy makers, designers and evaluators with varying degrees of familiarity with the complexity sciences develop a shared understanding of systemic processes. The research identifies, defines and illustrates sixteen key characteristics of complex systems and contributes to an evolving visual language of complexity. The research process involved collaboration between myself and the CECAN research group: Alex Penn, Pete Barbrook-Johnson, Martha Bicket and Dione Hills. This paper describes the research process and reflects on its contribution.
The project started with a research proposal I submitted to CECAN in an open call for proposals in July 2017. My research project was funded as a small project (16 days) to visually represent key aspects of complexity. I started conversations with CECAN project mentors in September 2017. As I worked with the CECAN team exploring potential research processes and outcomes, I modified my initial proposal to accommodate newly articulated concerns and newly identified project goals. A new research process was designed to identify, define and illustrate key characteristics of complexity with surveys, participatory design research and the design of new illustrations. The first step was to identify the specific features to be illustrated. During early meetings and two participatory workshops a total of sixteen characteristics were identified. The key characteristics of complex systems were identified as: feedback, emergence, self-organization, levers / hubs, non-linearity, domains of stability, adaptation, path dependency, tipping points, change over time, unpredictability, unknowns, distributed control, nested systems and multiple scales. Once this initial stage was completed, I sought to gather information from communities within the CECAN network and beyond.
In order to collect ideas from academics, sustainability practitioners and designers with expertise in the visualisation of complexity, systems mapping and design, I brought the research project to the Relating Systems Thinking and Design RSD6 The Environment, Economy, Democracy: Flourishing Together RSD6 conference (at the Oslo School of Architecture and Design, Oslo, Norway, October 18-20, 2017). At RSD6 I was offered a last-minute opportunity to run a participatory session at the plenary with approximately one hundred people. After a brief introduction, I distributed 50 surveys with twelve key characteristics of complexity (four more were added later). I asked the group to work in pairs to visualise each concept. I collected 47 surveys with visualisations for each characteristic. These activities (including pictures of multiple surveys) are documented on the #RSD6 hashtag on Twitter.
I organised the images by collecting all examples for each characteristic on seperate sheets. These were organised by type on two axes based on similarities in visual devices, visual strategies and visual metaphors. Arranging the images in this way enabled the identification of patterns. Most concepts were commonly understood with some similar visual conventions – although there were often other random, unique and provocative outlier interpretations.
These characteristics sheets were then used as a basis for two participatory design workshops in London with the CECAN research group (November 17 & December 15, 2017). I facilitated group crits to discuss the images in detail with an emphasis on encouraging particular interpretations for each characteristic. We did not rely on popularity as the basis on which a final graphic would be designed. In some cases the group wanted an entirely new image. The group sought images that captured the essential characteristics of each concept according to group discussions. Along with facilitating the identification and development of definitions, new examples and learning points with the CECAN research group, I designed new visual outcomes for each of the characteristics (according to instructions from the group over four months). The CECAN research was completed in April 2018 with the outcome of an A1 poster (figure 1).
The research project created space to collect ideas and visualisations, to critically assess visual strategies and to design new visual representations of sixteen key features of complexity. Within this interdisciplinary and participatory design research process, we used visual methods to explore visual proposals and come to enough of a shared understanding of the sixteen key concepts to create a new visual representations of each characteristic. The participatory design process resulted in scope creep as the work expanded with the involvement of people pulling in different directions. The initial brief for this research and my original research proposal were different from the ideas that were developed for the outcomes half way through the project. The name of the project changed from “A Typology of Visual Codes for Systemic Relations” to “The Visual Representation of Complexity: Sixteen Key Characteristics of Complex Systems.” Newly articulated directions emerged as the CECAN research group experimented with images to capture particular interpretations of complexity.
With financial assistance from Loughborough University, I bought the project to RSD7 in Torino, Italy in October 2018 and made the slideshow and collection of images from the RSD6 surveys publicly available. The Visual Representation of Complexity project supports informed decision-making at CECAN and other communities engaged with the analysis of complex problems. The poster with the sixteen key characteristics with definitions, learning points, examples and illustrations can be used as a learning resource for practitioners, academics and students alike. The visual methods facilitated both knowledge production and dissemination. The artwork has circulated widely in the CECAN network, within the Systemic Design Research Network’s (SDRN) Relating Systems Thinking and Design annual conferences (RSD6 and RSD7) and in the wider complexity community on Twitter. The images will be used in an upcoming CECAN publication: the Magenta Book Annex on dealing with complexity in evaluation. The visualisations will continue to support relational ways of understanding complex phenomenon.
| Item Type: | Conference/Workshop Item (Paper) |
|---|---|
| Uncontrolled Keywords: | Visual complexity, Participatory design, Visual representation |
| Related URLs: | |
| Date Deposited: | 16 Jul 2019 13:43 |
| Last Modified: | 20 Dec 2021 16:09 |
| URI: | https://openresearch.ocadu.ca/id/eprint/2737 |
Actions (login required)
 |
Edit View |