Analyzing Visualized Complexity
 Tools
Tools Tools
Tools


Gulden, Tore (2020) Analyzing Visualized Complexity. In: Proceedings of Relating Systems Thinking and Design (RSD9) 2020 Symposium., 9-17 Oct 2020, Ahmedabad, India.
Preview |
Text
Gulden_Analyzing_RSD9_2020.pdf Available under License Creative Commons Attribution Non-commercial No Derivatives. Download (247kB) | Preview |
![[thumbnail of Gulden_Analyzing_RSD9_2020.png]](https://openresearch.ocadu.ca/id/eprint/3644/2/Gulden_Analyzing_RSD9_2020.png "Gulden_Analyzing_RSD9_2020.png") 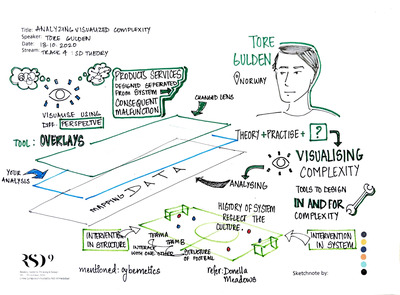 Preview |
Image
Gulden_Analyzing_RSD9_2020.png Available under License Creative Commons Attribution Non-commercial No Derivatives. Download (1MB) | Preview |
![[thumbnail of Gulden_Analyzing1_RSD9_2020.png]](https://openresearch.ocadu.ca/id/eprint/3644/3/Gulden_Analyzing1_RSD9_2020.png "Gulden_Analyzing1_RSD9_2020.png") 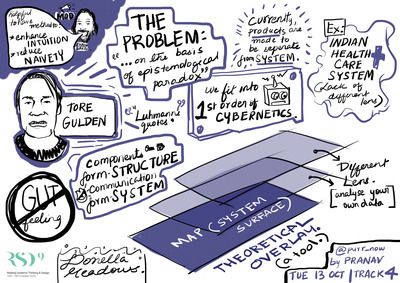 Preview |
Image
Gulden_Analyzing1_RSD9_2020.png Available under License Creative Commons Attribution Non-commercial No Derivatives. Download (3MB) | Preview |
Abstract
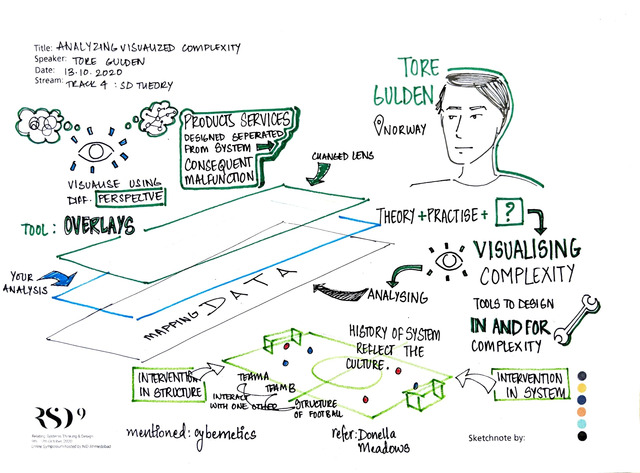
Within the field of systems-oriented design (SOD) students and practitioners visualize their data by GIGA maps (Sevaldson, 2013), Synthesis maps (Jones & Bowes, 2017), or in general terms, maps where exceedingly complex systems and structures are visualized, a praxis which in this article is called Visualizing complexity. Visualizing complexity praxis has contributed for designers to work with and utilize for processes to expand the complexity of wicked problems and to handle and intervene in these contexts, as the process involves the synthesizing of all empirical data as a whole.
Although the visualizing complexity praxis is a paramount method for working throughout a holistic perspective for designers, the processes so far are lacking methods for analyzing the empirical data synthesized in the maps to develop a fundament for the succeeding design. Students and practitioners often visualize the necessary amount of empirical data with sufficient quality in their maps. However, the analysis and designing of products or services based on these maps originate from the romantic belief of the designers gut-feeling as a tool for data analysis and creation.
Unfortunately, this often leads to the designing of parts separately rather than designing the interaction between parts, that is the designing of systems (Russell L. Ackoff, 1974) which in turn may lead to malfunctioning products, services, and missing potentials for functioning concepts. This article describes ongoing research that contributes to perspectives and methods for analyzing the visualized complexity that the maps contain to increase the quality of the systems-oriented design process. The work is inspired and based on the empirical data that various systems-oriented design processes performed by students and practitioners comprise since I developed the course Visualizing complexity in 2010 at Oslo Metropolitan University on masters level at the Department of product design.
The role of the empirical data in this article however has solely been to recognize the problem with the method and as examples that support a theoretical conversation. That is, the main contribution of this research is based on a theoretical conversation originated in systems theory and cybernetics (Krippendorff, 2019). This conversation has brought forth the two perspectives for map analysis that have been incorporated in the course Visualizing complexity. Firstly, that act of dividing structure and systems as a method for system analysis and secondly, analysis by the theoretical overlay.
| Item Type: | Conference/Workshop Item (Paper) |
|---|---|
| Divisions: | Faculty of Design |
| Date Deposited: | 06 May 2022 18:01 |
| Last Modified: | 06 May 2022 18:15 |
| URI: | https://openresearch.ocadu.ca/id/eprint/3644 |
Actions (login required)
 |
Edit View |