Measuring Sophistication in Systemic Design and Computing
 Lists
Lists Lists
Lists


Barba, Evan and Osborn, J.R. (2018) Measuring Sophistication in Systemic Design and Computing. In: Proceedings of RSD7, Relating Systems Thinking and Design 7, 23-26 Oct 2018, Turin, Italy.
Preview |
Text
Barba_Slides_2019.pdf Download (4MB) | Preview |
![[thumbnail of Barba_Osborn_MM_2018.jpg]](https://openresearch.ocadu.ca/id/eprint/2735/2/Barba_Osborn_MM_2018.jpg "Barba_Osborn_MM_2018.jpg")  Preview |
Image
Barba_Osborn_MM_2018.jpg Download (333kB) | Preview |
Abstract
Introduction
Over the past decade there has been a growing recognition among educa- tors that systems, design, and computing, are the three disciplines that best encompass the skills and knowledge workers need to successfully contribu- te in the 21st century workforce (AAAS, 2009; Uri Wilensky and Mitchel Resnick, 1999). Yet, in addition to the many complexities that arise in educa- tion, developing curricula that successful mesh these disciplines introduces new and understudied complexities; particularly, when it comes to integra- ting those curricula into schools and matching them to current educatio- nal standards and metrics. In this presentation, we describe the theoreticalunderpinnings and practical benefits and challenges of our curriculum inSystemic Design and Computing (SDC) based on three iterations of a pilot course.
Our SDC curriculum treats systems thinking as a worldview that can be used to organize knowledge, formulate problems, and evaluate solutions, design as a set of methods for synthesizing and communicating solutions, and computing as a medium for implementing, testing, and deploying tho- se solutions. It is rooted in the idea that teaching students a small set of cross-cutting concepts and skills while training them to apply those skills innew contexts can provide a firm but flexible foundation to build on over thecourse of their lifetimes.
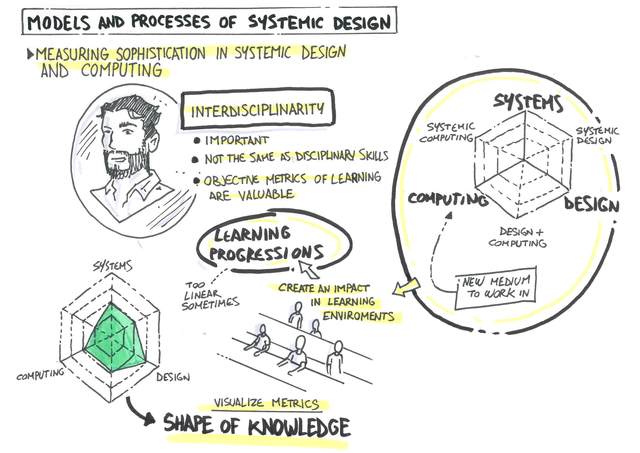
We evaluate our pilot course and evolving curriculum in the context of Learning Progressions (LPs) (Alicia & Alonzo, 2011; Black & Simon, 1992;Rogat, Corcoran and Mosher, 2010), extending that research by defining a quantifiable notion of sophistication in SDC concepts and skills. Using spi- der-graphs to chart student progress along multiple dimensions and deve- loping quantitative measures based on the emergent properties of thesegraphs we have developed a flexible but consistent framework that captu- res and communicates the complexity of interdisciplinary learning withoutsacrificing our ability to track and compare student and cohort progress.Our hope is that by systematically investigating how students progress in their learning of SDC concepts and practices, we can understand the most effective ways to create the coherent, multi-dimensional, and engaging cur- ricular experiences that students need to mature into effective and adap- table lifelong learners.
SDC Progress Variables
Typically, sophistication, the core metric of LPs, is defined by grade-level expectations or disciplinary knowledge, but measuring it has proved diffi- cult and at times controversial. Progress maps [Hess, 2012; Hess. 2008; Wil- son and Draney, 2004) in which student performance is ranked graphical- ly on a continuum, have been praised as consistent, reliable, and practicalmeasures of student performance, with the added benefit of easily commu- nicating results. They have proven useful in providing timely feedback to students and teachers as part of formative assessment, and can be combined with an underlying statistical model for longitudinal and group comparison, something education researchers value highly.
For our pilot course, we used six progress variables that embody a few key concepts in SDC. These are one example and are not intended to be doctri- ne or all-encompassing. Three of these progress variables, system mapping, visualization, and algorithms represent collections of essential skills and knowledge in each SDC discipline. However, the SDC curriculum and LP also aim to teach students how to integrate disciplinary concepts. So, in addition, we defined three progress variables that embody the knowledge and skills for the intersections of each of the disciplines (a similar approach was used by Rowland (Rowland, 1999). The three intersections are Systems+Design, Design+Computing, and Computing+Systems (the “+” indicates deep integra- tion, not simply adding one discipline onto the other) and the associated pro- gress variables are iteration, interactivity, and modeling, respectively. The resulting structure allows us to map student progress across six intercon-nected axes: the three “core” fields of systems, design, and computing plus the three intersections that connect these fields.
Measuring Sophistication
The measurement model we have developed is both a basis for evaluating progress in student understanding and a way of communicating that pro- gress back to students. Our approach uses a multidimensional variation of a progress map employing spider graphs (also called radar charts). The re- sult of connecting individual numerical values on a radar chart is a polygon whose shape gives a holistic picture of the learner at glance (Figure 1). Howe- ver, another important characteristic of these charts, which has been com- pletely overlooked in the literature, stems from the fact that the polygon has emergent properties (area, center of mass, eccentricity) that are readilyapparent in the visualization but difficult to dig out of the data, despite beingstraightforward calculations. These emergent attributes of the polygon pro- vide quantitative metrics for measuring sophistication in SDC.
The area of the polygon in Figure 1 denotes the overall level of the learner’s sophistication, providing a single collective variable that measures student learning along all SDC dimensions, this is a replacement for a course grade or GPA in this system. This value can be used to verify quantitatively that learning is taking place, or combined with the additional variables to reveal a wealth of insights, described below, that are typically hidden by traditio- nal grading systems.
Another emergent property of these graphs, the center of mass (or centroid) of the polygon, shows where a student’s focus and core-competency lies. Calculating the centroid, and using it alongside the origin (center) of the radar chart as foci in an ellipse (see Figure 1) allows us to calculate a third value, the eccentricity. Eccentricity provides a measure of the depth of a stu- dent’s specialization (a “well-rounded” student with equal skill in all areas will have a circle with 0 eccentricity). Students may choose to become more eccentric by specializing in one discipline, or try to balance out by becoming more circular. The point is to provide clear and digestible information for students to make the choice which best suits their goals, while maintaining the ability to compare students and cohorts. Students of equal sophistication (area) can have very different shapes, eccentricities, and centers of mass.
As we deployed the above methodology and measurement model in paral-lel with our traditional grading scheme, we noted many benefits and some drawbacks. Benefits include: tailoring a curriculum, comparing across dif-ferent subject matter, measuring integrated learning, and overall flexibili-ty. While drawbacks include difficulty standardizing across courses, timerequired for mentoring, and students’ desire to “optimize.” These will be di- scussed in depth in our presentation.
| Item Type: | Conference/Workshop Item (Lecture) |
|---|---|
| Uncontrolled Keywords: | Systemic Design; Education; Computing; Recursive Design |
| Related URLs: | |
| Date Deposited: | 11 Jul 2019 21:32 |
| Last Modified: | 20 Dec 2021 16:19 |
| URI: | https://openresearch.ocadu.ca/id/eprint/2735 |
Actions (login required)
 |
Edit View |